Jumping from 14th to 9th place in one year, Seattle leapt forward in the Trust for Public Land (TPL) ParkScore index in 2021 due to an increase in new park acreage. Seattle also performed well as a result of broad park access and high levels of park investment.
Each year, TPL evaluates parks systems in the 100 most populated American cities and ranks the cities using its methodology. Washington, D.C. came in first in 2021 for the city’s strong performance on the new equity measures added to the ParkScore index this year. In 2019, Seattle came in 11th.
| Rank | City | ParkScore (Max: 100) |
| 1 | Washington, DC | 84.4 |
| 2 | St. Paul, MN | 80.0 |
| 3 | Minneapolis, MN | 79.7 |
| 4 | Arlington, VA | 79.6 |
| 5 | Chicago, IL | 77.2 |
| 6 | San Francisco, CA | 76.3 |
| 7 | Irvine, CA | 76.0 |
| 8 | Cincinnati, OH | 75.9 |
| 9 | Seattle, WA | 75.4 |
| 10 | Portland, OR | 75.0 |
TPL measures equity by comparing the per capita park space in neighborhoods of color versus white neighborhoods and in low-income neighborhoods versus high-income neighborhoods. It also assesses 10-minute-walk park access for people of color and lower-income residents and awards higher scores to cities with zero or low disparities.
Park investment and amenities are also evaluated as part of TPL’s ParkScore methodology. Let’s take a look on how Seattle performed on these metrics.
Does Seattle have an equitable distribution of parks?
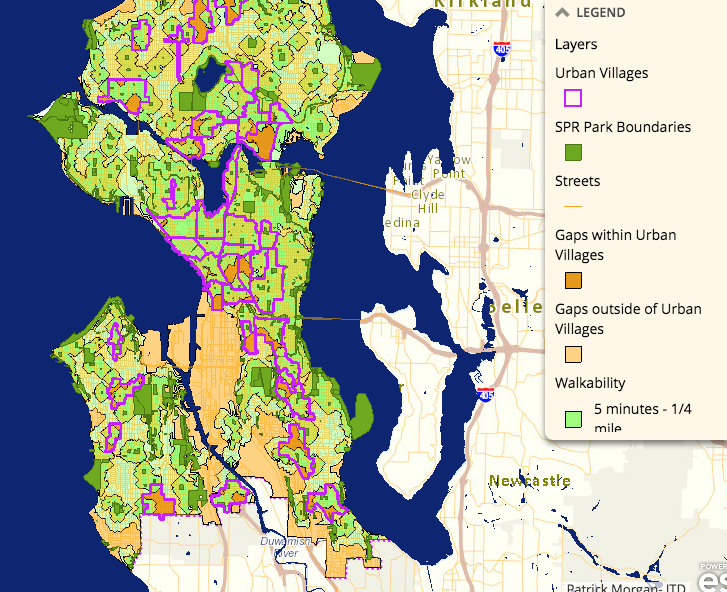
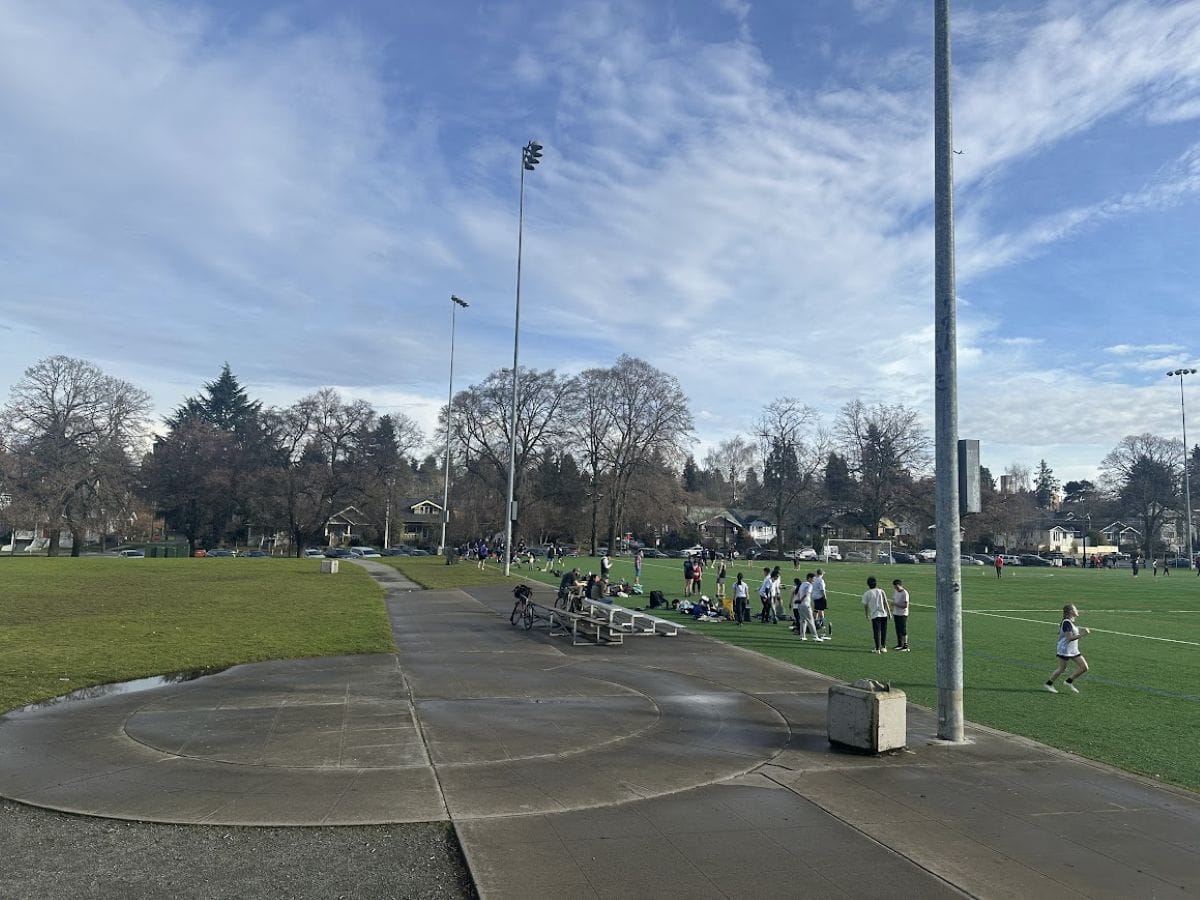
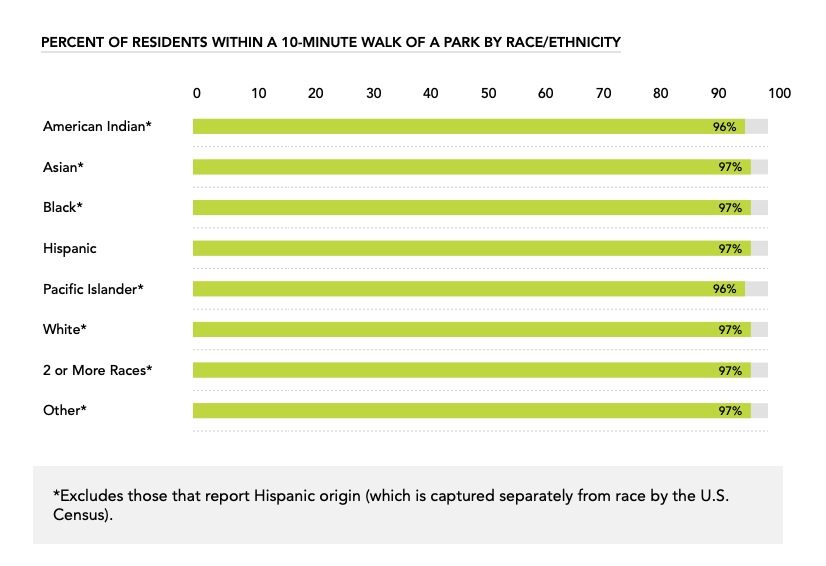
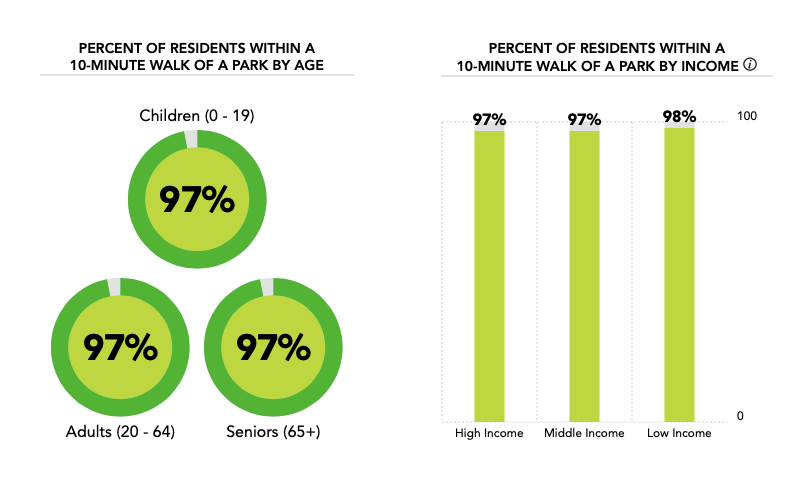
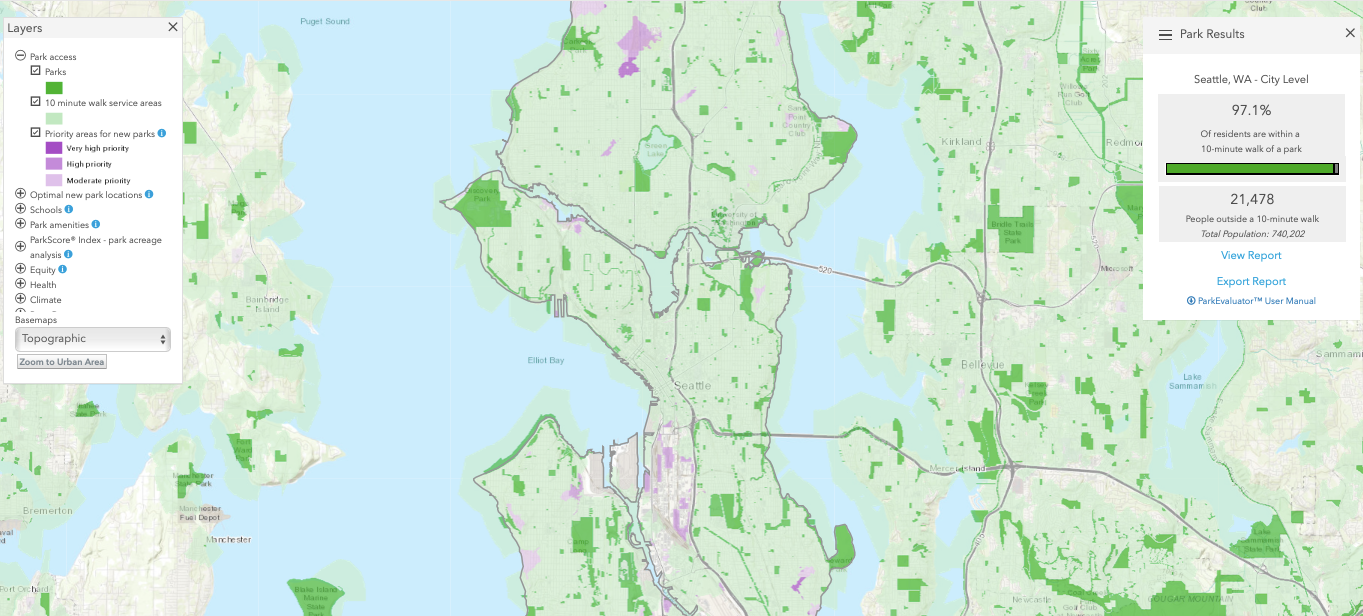
Seattle received an above-average score park equity. Across residents of all ages and races in Seattle, approximately 97% of Seattleites live within a 10-minute walk of a park, far higher than the national average of 55%. The city also scored very highly for access with a strong majority Seattleites of all income levels living with a 10-minute park walkshed. Only two American cities (Boston and San Francisco) have achieved the TPL goal of ensuring 100% of residents live within a 10-minute walk of a park.
The measurements for park accessibility use advanced GIS (Geographic Information Systems) and spatial analysis for evaluation. Instead of only measuring distance to a local park, the rating system’s GIS technology considers the location of park entrances and physical obstacles to access as well. Thus, if residents are separated from a nearby park by a major highway, the ParkScore index won’t count the park as accessible to those residents, unless there is a bridge, underpass, or easy access point across the highway.
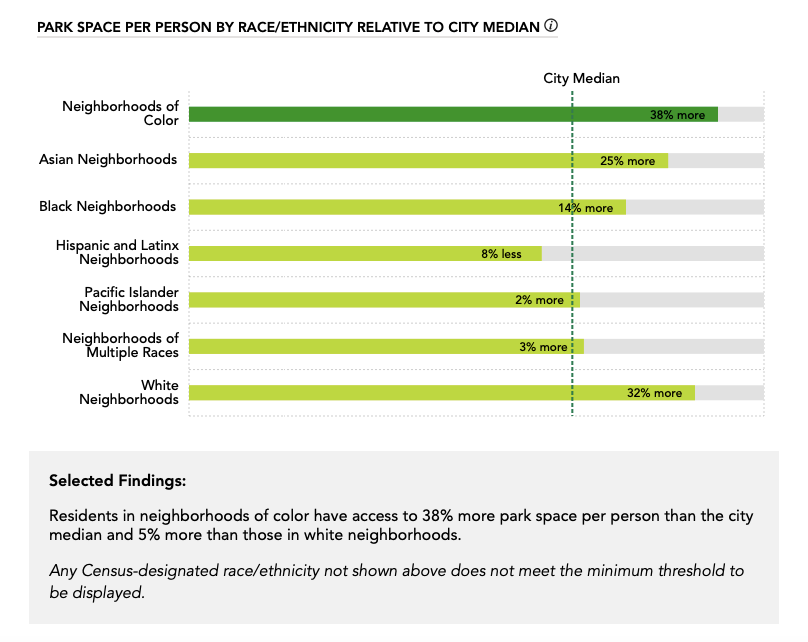
Looking closer at park equity in Seattle, park space or acreage emerged as another strength. Neighborhoods of color in Seattle actually have 38% more park space per resident than the city median; however, discrepancies do occur when you analyze the data by race and ethnicity. Neighborhoods where a large number of residents identify as Hispanic had the least amount of park space of any group, falling short of the city median by 8%. Some of Seattle’s largest parks also tend to be in wealthier and Whiter neighborhoods, often enveloped in single family zoning, while smaller parks must serve denser apartment-heavy neighborhoods.
The answer to why Hispanic-identified Seattleites have less park space in their neighborhoods may be found in the Duwamish Valley. According to population estimates, the census tract encompassing Georgetown and South Park has the highest percentage of Hispanic residents in the city, about 33%. Both of these residential neighborhoods are also located near industrial areas and struggle with pollution and environmental contamination.
In terms of equity, low-income neighborhoods did fall below the city median for park space per person (13% less) while high-income neighborhoods exceeded the city median for park space by 36%. In general, Seattle has slightly smaller amount of land dedicated to park space (11%) than the national average (15%).
To dive deeper into analyzing park access, it is possible to access TPL’s mapping application which illustrates the distribution of park space across 14,000 different cities. The goal of map is to help cities pinpoint where to focus future park investment. It also offers a very cool ParkEvaluator tool, which allows you to draw in new parks and trails which can be used to create new projections for 10-minute walkshed access.
“We need parks more than ever, and park advocates are gearing up for a fight,” said Bill Lee, Senior Vice President for Policy, Advocacy and Government Relations at TPL in a press release. In order to help parks better weather the financial storm, TPL is advocating for Congress to pass the Parks, Jobs, and Equity Act, which would require a $500 million investment in local parks as part of a future infrastructure package. The organization has also appealed to the private sector to invest $50 million through its Equitable Communities Fund, which aims to create parks and open space in historically marginalized communities.
According to data from the City of Seattle, the budget for Seattle Parks and Recreation decreased by about 13% between 2020 and 2021, mostly in the form of reduced support for capital projects, whose budget declined from approximately $87 million in 2020 to $53 million in 2021. It is currently unknown what funding levels for Seattle Parks and Recreation will look like for 2022 and beyond.
Correction: The average number of playgrounds should have been per 10,000 residents, not per 100,000 residents. This has been corrected.